Archives for category: NASA

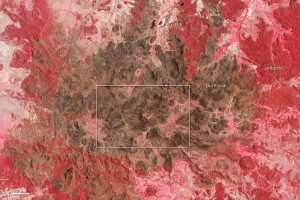
On the afternoon of January 14, 2013, a fierce bushfire swept across the campus of Siding Spring Observatory, a world-class astronomy facility on a ridge in Australia’s Warrumbungle National Park. The observatory is home to some of the most powerful sky-mapping telescopes in the world.

Ten years earlier, a brush fire devastated one of Australia’s other top observatories, so the staff of Siding Spring feared that history was repeating itself. As the fire reached the observatory’s campus, cameras and telescopes sent back disturbing images of flames lapping at the doorsteps of buildings and smoke billowing overhead.

By nightfall on January 14, the situation looked dire to the scientists and staff who had evacuated and were left to monitor the situation online. A handful of buildings on the campus were on fire. At one point, a thermometer on campus recorded a spike in air temperatures to 100 degrees Celsius (212 degrees Fahrenheit).

Read full story at:

Earth Observatory, February 2013

Mine Collapse in Turkey

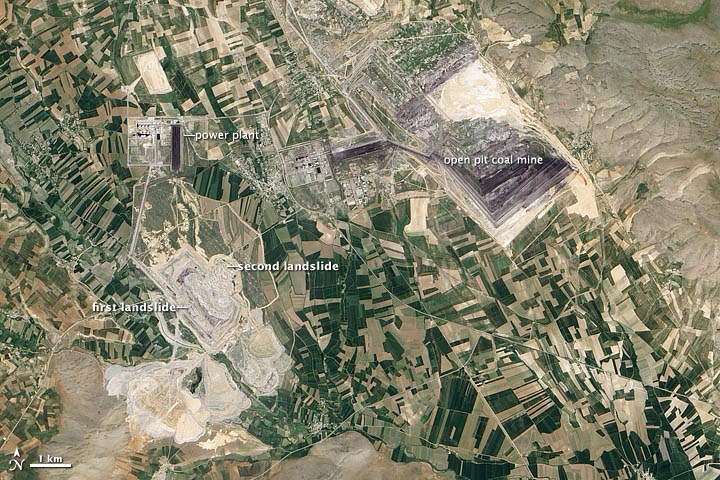
At 10 a.m. on February 10, 2011, disaster struck the Çöllolar coalfield in central Turkey, near the city of Elbistan. The northeastern wall of an open-pit mine collapsed, sending about 50 million tons of material into the mine. The debris buried and killed ten workers.

The collapse was the second at the same mine within a week. Four days earlier, a smaller landslide damaged the opposite wall and killed one person. According to a United Nations report, debris from the two landslides covered 2.73 square kilometers (1 square mile). The larger landslide extended 350 meters (1,150 feet) past the original perimeter of the pit. Inadequate drainage of the mine walls likely caused the landslides, according to Caner Zanbak, an environmental adviser to the Turkish Chemical Manufacturers Association.

Read full story at:

Earth Observatory, June 2012


Siberia Burns

Siberia Burns

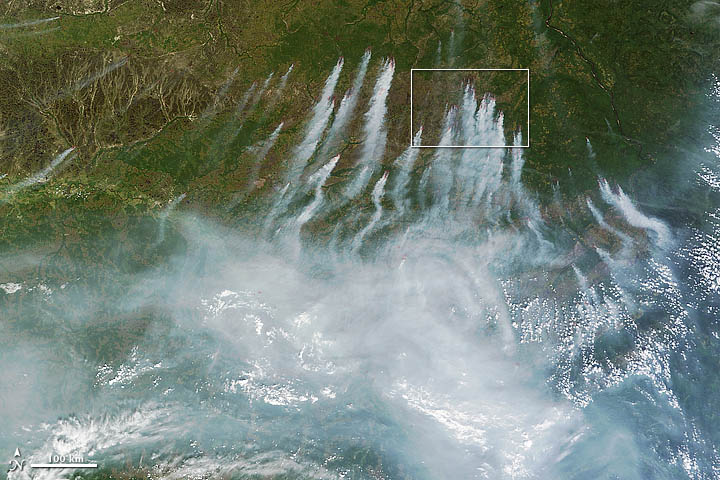
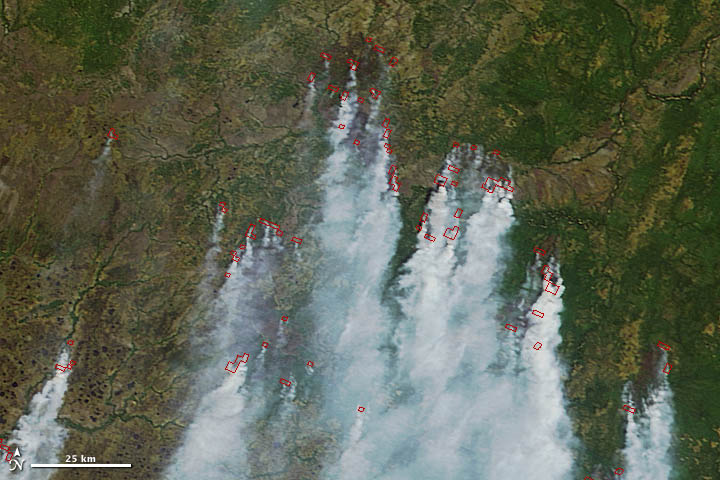
On June 18, 2012, a total of 198 wildfires burned across Russia and had charred an area that covered 8,330 hectares (32 square miles). Many were in central Russia, where firefighters have battled uncontrolled fires for months.

The latest flare-up prompted Russian authorities to declare a state of emergency in seven regions, including the Khanty-Mansiisk autonomous area, the Tyva Republic, the Sakha Republic, Krasnoyarsk, Amur, Zabaikalsky, and Sakhalin.

Read full story at:

Earth Observatory, June 2012

Wheat Fires in China

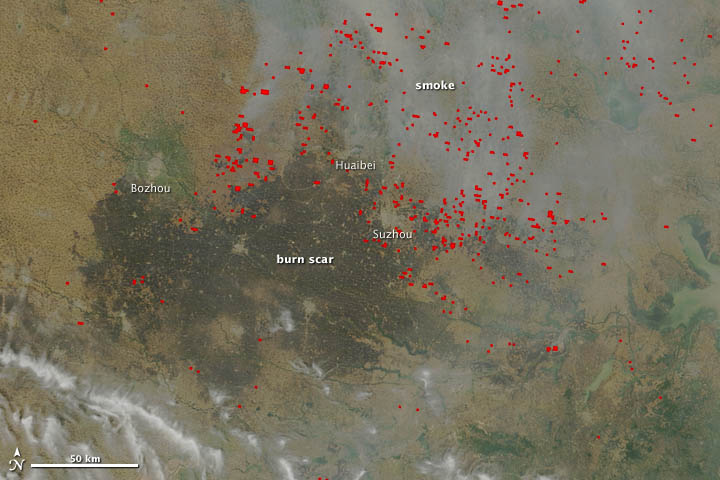
In mid-June, agricultural fires and industrial pollution combined to leave a thick pall of haze over central China. The Moderate Resolution Imaging Spectroradiometer (MODIS) on NASA’s Terra satellite captured these true-color (top) and false-color (bottom) images of the fires and haze. Both images were acquired at 10:55 a.m. local time (02:55 UTC) on June 13, 2012.

Smoke and actively burning fires (shown with red outlines) are visible in the true-color image, as well as a large burn scar. The false-color image reveals details of the burn scar that aren’t readily apparent in the true-color view. Although the burn scar looks uniform, the false-color view indicates that numerous fields with unburned vegetation (shown as green) are scattered throughout the area. The cities of Bozhou, Huaibei, and Suzhou, which appear as gray patches, were the closest cities to actively-burning fires when Terra acquired the images.

Read full story:

Earth Observatory, June 2012


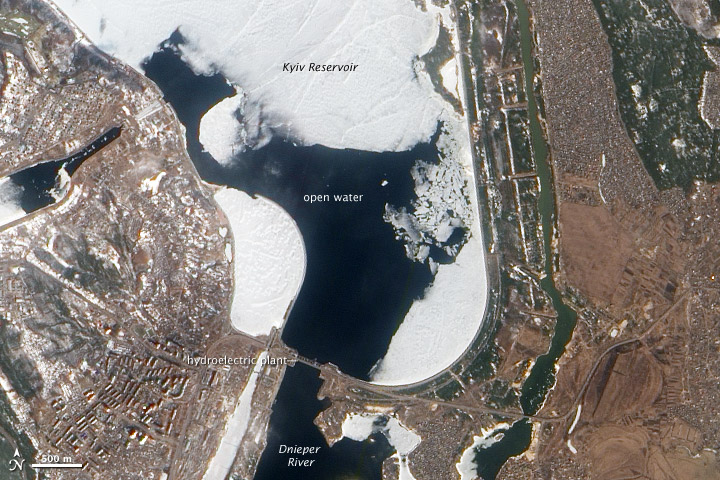
After an unsually cold winter in Ukraine, the spring melting of the Kyiv (or Kiev) Reservoir on the Dnieper Riverhas caused potentially hazardous rafts of ice to start drifting toward a dam and hydroelectric plant at the southern edge of the reservoir.

When the Advanced Land Imager on NASA’s Earth Observing-1 (EO-1) satellite captured this natural-color image on March 17, 2012, open water still surrounded the dam, but many pieces of ice were visible just to the north. Although Ukrainian authorities are monitoring the dam closely, they believe the risk that the dam will fail is small.

The average thickness of the ice on the reservoir is about 40 centimeters (16 inches), half what it was in 2011 when heavy flooding prompted officials to abruptly lower the water level of the reservoir. According to the National Radio Company of the Ukraine, the CEO of the company that operates the dam doesn’t expect similar action will be needed this year.

Earth Observatory, March 2012

Many types of aerosol particles circulate in the atmosphere, but one of the most damaging to human health is known as PM2.5, a technical term for microscopic bits of matter less than 2.5 microns in diameter (one thirtieth the width of a human hair). These small pollutants, which come mostly from burning fossil fuels and biomass, can lodge deep in the lungs, where they exacerbate a variety of respiratory and cardiovascular diseases.

Ground-based instruments are the standard for monitoring PM2.5 in many industrialized nations. For example, the U.S. Environmental Protection Agency, along with state and local governments, maintain a network of about10,000 ground stations that generate real-time air quality measurements for hundreds of cities. Such data gets funneled into services like AIRNow, which issues warnings when pollution reaches unsafe levels.

However, not all countries have ground-based monitoring systems that measure such fine-grained pollutants.China, like most countries, has traditionally only monitored a larger type of particle pollution known as PM10. Though Chinese leaders have announced a plan to monitor PM2.5 more broadly in the future, to date only a handful of cities have started to publish PM2.5 numbers.

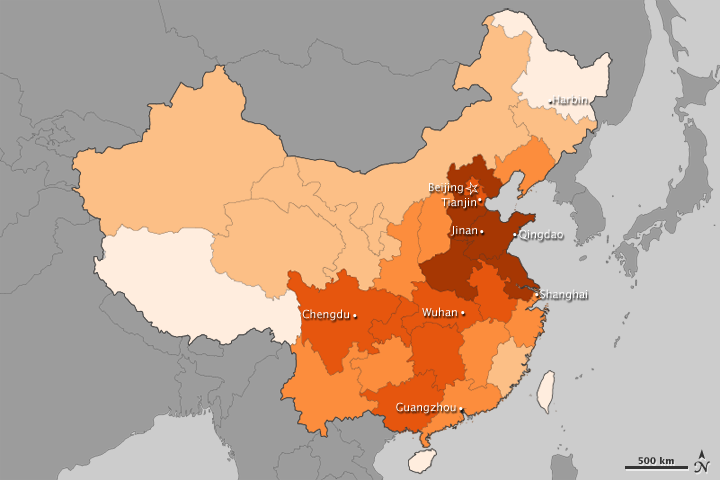
Satellites offer a perspective on PM2.5 that is particularly useful when ground instruments are unavailable or offer limited information. With that in mind, researchers at Columbia University’s Earth Institute and Batelle Memorial Institute have developed maps based on satellite data that depict annual PM2.5 exposure in all of China’s provinces.

The map above, which shows annual exposure between 2008-2010, indicates that most areas had PM2.5 levels that exceeded World Health Organization guidelines (10 micrograms per cubic meter). Areas surrounding Beijing and to the south along the coast, which fall in China’s industrial heartland, had the most pollution. In many cases, annual exposure was above 40 micrograms per cubic meter. Other provinces in eastern and south central China had pollution levels above 30 micrograms per cubic meter. For comparison, the New York, Chicago, and Los Angeles metro areas have PM2.5 levels that average between 10 and 20 micrograms per cubic meter.

The values used to create the map were derived from a method that Dalhousie University scientist Aaron van Donkelaar developed and published in Environmental Health Perspectives in 2010. At the time, van Donkelaar released a global map of PM2.5 pollution. Both that map and the map above are based on data from the Multi-angle Imaging Spectroradiometer (MISR) instrument on the Terra satellite, the Moderate Resolution Imaging Spectroradiometer (MODIS) instrument on the Terra and Aqua satellites, and a chemical transport model calledGEOS-Chem.

While satellite measurements are the best option in areas with limited ground monitoring, they are not without shortcomings. Satellites, for example, have difficulty detecting pollution over bright surfaces, such as snow and deserts. Overall, the researchers say the uncertainty amounts to about 6.7 micrograms per cubic meter.

NASA Earth Observatory, March 2012