Archives for category: 2012

celebration birthday cupcake - 100The anti-aging industry is booming. Twenty years ago, there was no such thing as an “anti-aging” or “longevity” clinic. Today, many major cities house dozens.

Step inside one, and you’ll likely encounter an assortment of remedies ranging from multivitamin cocktails to hormone injections to miracle pills that, if you believe the pitches, will guarantee you youthful entry into the triple digits.

There’s just one wrinkle. Although often lucrative for physicians, evidence suggests that many of the treatments anti-aging doctors tout don’t actually work—and some may be downright dangerous. “You really have to be careful,” says Loren Schechter, chairman of the patient safety committee for the American Society of Plastic Surgeons. “There are a lot of extravagant claims out there that simply don’t check out when you look at the science.”

Consider vitamins and supplements, for example. Most are harmless and possibly helpful in moderate doses, but a growing body of evidence shows that in excess, they can cause problems. Getting too much vitamin A, for example, has been linked to osteoporosis, vitamin B to nerve damage, and vitamin E to cancer.

Read full story:

US News, May 2012

Medicine’s focus has long been on treating specific diseases. We have radiation treatments to combat cancer tumors, cholesterol-lowering drugs to stave off heart attacks, andinsulin to control diabetes.

But imagine if there were a drug that would slow down the aging process itself, a drug that didn’t just treat a single disease but instead targeted multiple diseases of old age at once? It may sound far-fetched, but that’s precisely what longevity scientists are working hard to produce.

“It’s not just that we’re trying to make people live longer; we’re trying to make people live healthier. This is an exciting time for research,” says Felipe Sierra, director of the Division of Aging Biology at the National Institute on Aging.

Read full story:

USNews, May 2012


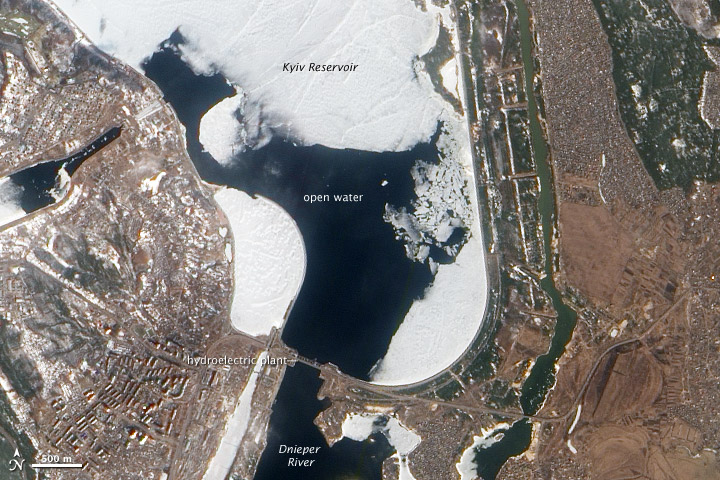
After an unsually cold winter in Ukraine, the spring melting of the Kyiv (or Kiev) Reservoir on the Dnieper Riverhas caused potentially hazardous rafts of ice to start drifting toward a dam and hydroelectric plant at the southern edge of the reservoir.

When the Advanced Land Imager on NASA’s Earth Observing-1 (EO-1) satellite captured this natural-color image on March 17, 2012, open water still surrounded the dam, but many pieces of ice were visible just to the north. Although Ukrainian authorities are monitoring the dam closely, they believe the risk that the dam will fail is small.

The average thickness of the ice on the reservoir is about 40 centimeters (16 inches), half what it was in 2011 when heavy flooding prompted officials to abruptly lower the water level of the reservoir. According to the National Radio Company of the Ukraine, the CEO of the company that operates the dam doesn’t expect similar action will be needed this year.

Earth Observatory, March 2012

Many types of aerosol particles circulate in the atmosphere, but one of the most damaging to human health is known as PM2.5, a technical term for microscopic bits of matter less than 2.5 microns in diameter (one thirtieth the width of a human hair). These small pollutants, which come mostly from burning fossil fuels and biomass, can lodge deep in the lungs, where they exacerbate a variety of respiratory and cardiovascular diseases.

Ground-based instruments are the standard for monitoring PM2.5 in many industrialized nations. For example, the U.S. Environmental Protection Agency, along with state and local governments, maintain a network of about10,000 ground stations that generate real-time air quality measurements for hundreds of cities. Such data gets funneled into services like AIRNow, which issues warnings when pollution reaches unsafe levels.

However, not all countries have ground-based monitoring systems that measure such fine-grained pollutants.China, like most countries, has traditionally only monitored a larger type of particle pollution known as PM10. Though Chinese leaders have announced a plan to monitor PM2.5 more broadly in the future, to date only a handful of cities have started to publish PM2.5 numbers.

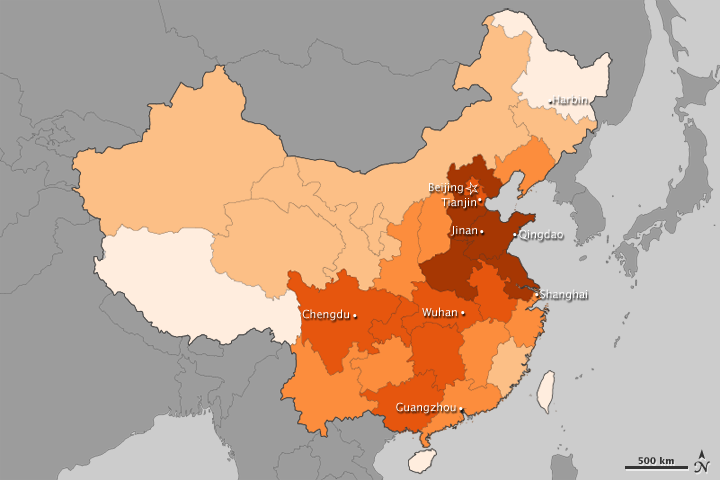
Satellites offer a perspective on PM2.5 that is particularly useful when ground instruments are unavailable or offer limited information. With that in mind, researchers at Columbia University’s Earth Institute and Batelle Memorial Institute have developed maps based on satellite data that depict annual PM2.5 exposure in all of China’s provinces.

The map above, which shows annual exposure between 2008-2010, indicates that most areas had PM2.5 levels that exceeded World Health Organization guidelines (10 micrograms per cubic meter). Areas surrounding Beijing and to the south along the coast, which fall in China’s industrial heartland, had the most pollution. In many cases, annual exposure was above 40 micrograms per cubic meter. Other provinces in eastern and south central China had pollution levels above 30 micrograms per cubic meter. For comparison, the New York, Chicago, and Los Angeles metro areas have PM2.5 levels that average between 10 and 20 micrograms per cubic meter.

The values used to create the map were derived from a method that Dalhousie University scientist Aaron van Donkelaar developed and published in Environmental Health Perspectives in 2010. At the time, van Donkelaar released a global map of PM2.5 pollution. Both that map and the map above are based on data from the Multi-angle Imaging Spectroradiometer (MISR) instrument on the Terra satellite, the Moderate Resolution Imaging Spectroradiometer (MODIS) instrument on the Terra and Aqua satellites, and a chemical transport model calledGEOS-Chem.

While satellite measurements are the best option in areas with limited ground monitoring, they are not without shortcomings. Satellites, for example, have difficulty detecting pollution over bright surfaces, such as snow and deserts. Overall, the researchers say the uncertainty amounts to about 6.7 micrograms per cubic meter.

NASA Earth Observatory, March 2012

In March 2012, a magnitude 9.0 earthquake—the fourth largest recorded since 1900—triggered a powerful tsunami that pummeled the northeastern coast of Japan. The earthquake occurred offshore, about 130 kilometers (80 miles) east of Sendai at 2:46 p.m. on March 11. Within 20 minutes, massive swells of water started to inundate the mainland.

The tallest waves and most devastating flooding from the 2011 T?hoku-oki tsunami occurred along the jagged coast of northern Honshu, a landscape dimpled with bays and coves known as ria coast. The steep, narrow bays of ria coasts trap and focus incoming tsunami waves, creating destructive swells and currents that can push huge volumes of water far inland, particularly along river channels.

That’s exactly what happened in the days before the Advanced Spaceborne Thermal Emission and Reflection Radiometer (ASTER), an instrument on NASA’s Terra satellite, captured the middle image above (on March 14, 2011). It shows severe flooding along the Kitakami River three days after the earthquake struck.

Earth Observatory, March 2012

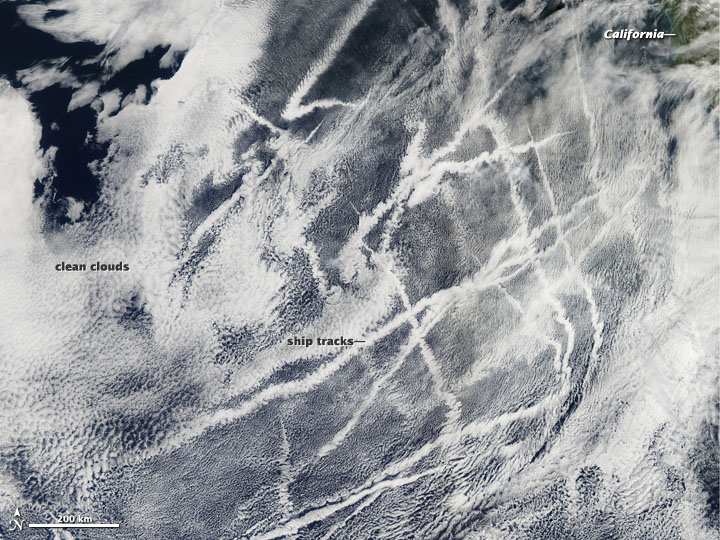
Ships churning across the Pacific Ocean left this cluster of bright cloud trails lingering in the atmosphere late last month. The narrow clouds, known as ship tracks, form when water vapor condenses around tiny particles of pollution that ships either emit directly as exhaust or that form as a result of gases within the exhaust.

The Moderate Resolution Imaging Spectroradiometer (MODIS) aboard the Aqua satellite captured this natural-color image on February 21, 2012. The criss-crossing clouds off the coast of California stretch many hundreds of kilometers from end to end. The narrow ends of the clouds are youngest, while the broader, wavier ends are older.

Some of the pollution particles generated by ships (especially sulfates) are soluble in water and can serve as the seeds around which cloud droplets form. Clouds infused with ship exhaust have more and smaller droplets than unpolluted clouds. As a result, light hitting the ship tracks scatters in many directions, making them appear brighter than other types of marine clouds, which are usually seeded by larger, naturally occurring particles such as sea salt. (In this image, the ship tracks don’t appear particularly bright because the surrounding clouds are also fairly bright. But in this March 2009 image and this July 2010 image the brightening effect of the pollution is quite clear.)

The enhanced reflectivity of ship tracks means they shade Earth’s surface from incoming sunlight, which produces a local cooling effect. However, determining whether ship emissions have a broader climate effect is complex because ships also emit pollutants that have a warming influence, such as carbon dioxide and black carbon. Research is ongoing, but one recent satellite study found that ship emissions do not cause changes on a large enough scale to affect climate significantly.

At the same time, researchers have shown that the ship emissions pose a clear hazard to human health. Seventy percent of all ship tracks occur within 500 kilometers of the coast, which means shipping exposes large numbers of people in coastal cites to high levels of health-sapping particulates. One study concluded, for example, that shipping-related particulate matter is responsible for 60,000 premature deaths each year, about 5 percent of the total premature deaths associated with particulate air pollution each year.

Earth Observatory, March 2012