In April 2016, I participated in Carbon 12, an artist residency in Jaipur, India. I wrote the essay below after spending about a week in Jaipur. Openings will be held at the Hotel Diggi Palace and The Egg Art Studio.
It was the absurd extremes of geology that first drew me to it. Geology is a field of science that take human conceptions of time, grinds them into pulp, and buries them under layers of sand. I am someone who finds peace in knowing that there are fossilized fish on Mount Everest. Think about that: creatures of the sea stranded on Earth’s highest point.
Geology is a science that crams continents together like puzzle pieces and then systematically tears them apart. It is a science that mashes beaches into mountains, rams them thousands of meters into the air, and then fastidiously dissembles them grain by precious grain. It is a science that takes small wobbles in Earth’s orbit and turns them into ice ages, a science that can hold all of human history in a few handfuls of sand.
The absurdity and incomprehensibility of time is the thread that unifies geology. If you took Earth’s 4.6 billion years and represented all of that time as a 24 hour day, the first people emerge at about 11:58 pm. We know this date because of carbon, an element forged in the bowels of stars where temperatures soar above 100,000,000 degrees Kelvin.
There are three types of carbon that occur naturally: Carbon-12, Carbon-13, and Carbon-14. Carbon-14, which has 14 neutrons, forms when cosmic rays — high energy particles from beyond the solar system — bombard Earth’s atmosphere. Living plants and animals constantly absorb Carbon-14, but they stop absorbing it when they die. Since Carbon-14 is radioactive and unstable, it immediately begins to decay into Carbon-12. Whatever the creature, the rate of decay is always the same. After 5,730 years, half of the Carbon-14 in any tooth, any strand of hair, any piece of wood, anything with carbon in it becomes Carbon-12. So by comparing the ratio of Carbon-14 to 12, geologists can tell you exactly how old something is.
The centrality of carbon to our world is astounding. Nothing that we consider living lacks carbon. When we head to the forest for quiet, we surround ourselves with carbon. When we heat our homes and fuel our cars, we burn carbon. When we paint and draw, we often smear carbon on canvas. When we marry, we attach chunks of carbon to our wedding rings. When we burn wood, we fill the air with tiny bits of blackened carbon.
There are two characteristics of carbon that make it such a flexible, ubiquitous, and essential element. First, it has a remarkable ability to bond with other elements, even those that are quite different. Second, carbon often arranges itself into long, flexible chains when it bonds.
These same features are built into the structure of Carbon-12, the Jaipur-based painting residency that inspired the work you see presented here. Just as I was drawn to geology for its extremes, I was drawn to Carbon-12 for its affinity for difference. The group includes artists from Iran (Roya Delkhosh), the United States (Katherine Tzu-Lan Mann), Lithuania (Audrius Grazys, Giedr? Riškut?, Dovile Norkute), Mexico (Margarita Chacon Bache), South Korea (Bo-Suk Lee), France (Melanie Challe), Norway (Grete Marstein), Chile (Joan Belmar), India (Premila Singh), and the Ivory Coast (Claudie Tit. Dimbeng). The works range from the abstract to the realistic, from the colorful to the colorless, from the intimate to the grandiose.
There is little doubt that in some ways our differences are profound. Vast gulfs in culture and experience meant the artists could assume little about the others when they began this collaboration. During the two weeks spent in Jaipur at the Hotel Diggi Palace making art, sometimes even basic communication was a challenge. We occasionally stumbled in conversations while we tried to remember some word or some place in a foreign language or country. We puzzled over our different habits, our different tastes, our different religions, and the different systems of government in our home countries.
Yet, despite our differences, we also found that we shared common unspoken languages as well: a fascination with light and color, with paint and paper, and with the city of Jaipur. We bonded over pulp and fiber at a handmade paper factory and stood agape as a local master painted elephants on a grain of rice.
Every atom of carbon has four empty spaces in it that electrons from elements of other types can fill. In fact, it’s these empty spaces that make it possible for carbon to bond so easily into seemingly unrelated things: coal, diamond, graphite, oil, soot, bone, leaf, blood, smoke, bark — all of these things are made of carbon but arranged in different ways or bonded with a different set of neighbors. The same spirit of exchange and transformation defines painting and infused the Carbon 12 residency.
I found myself drawn to Jaipur for the same reason I was drawn to geology — the absurdity of the extremes. Jaipur is a city where simple rickshaws and bicycles share the roads with luxury cars. It is a place where the stunning beauty of its textiles, its jewels, its palaces coexist with the realities of poverty. It is a place where the serenity of its temples and gardens compete with the acoustic inferno of its traffic horns, a place where the pleasant scents of curry — thousands of years of wisdom stewed to perfection — mingle in the streets with jasmine and the acrid scent of soot and sweat.
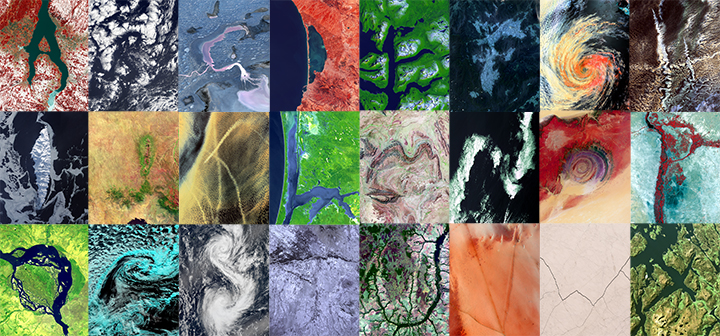
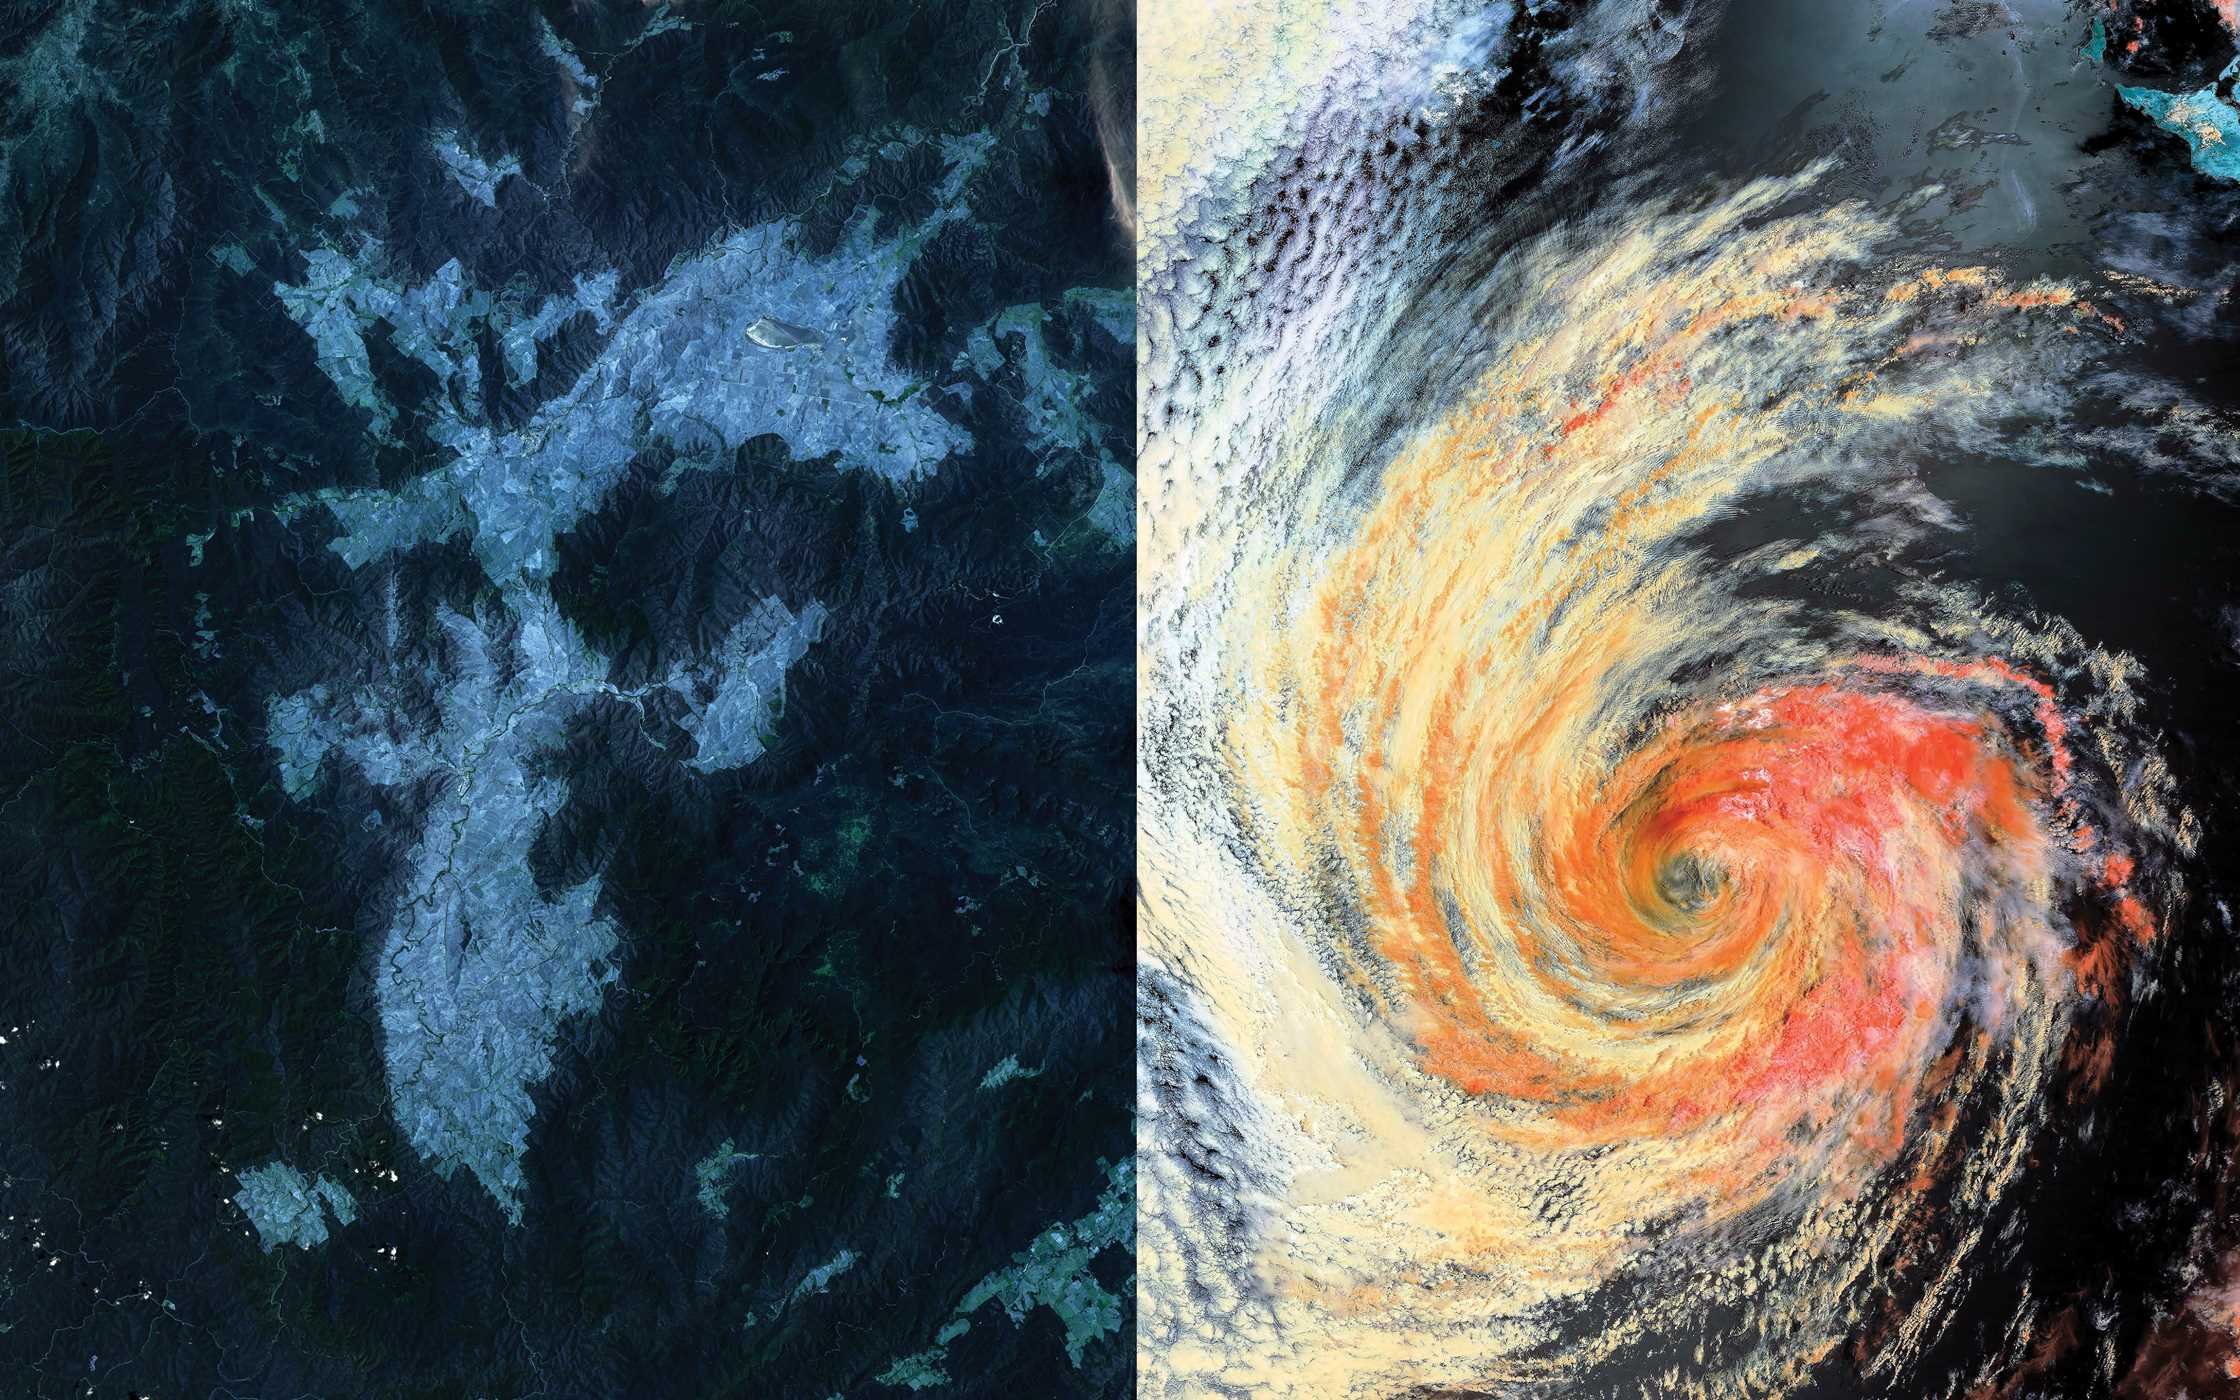
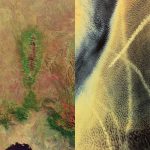
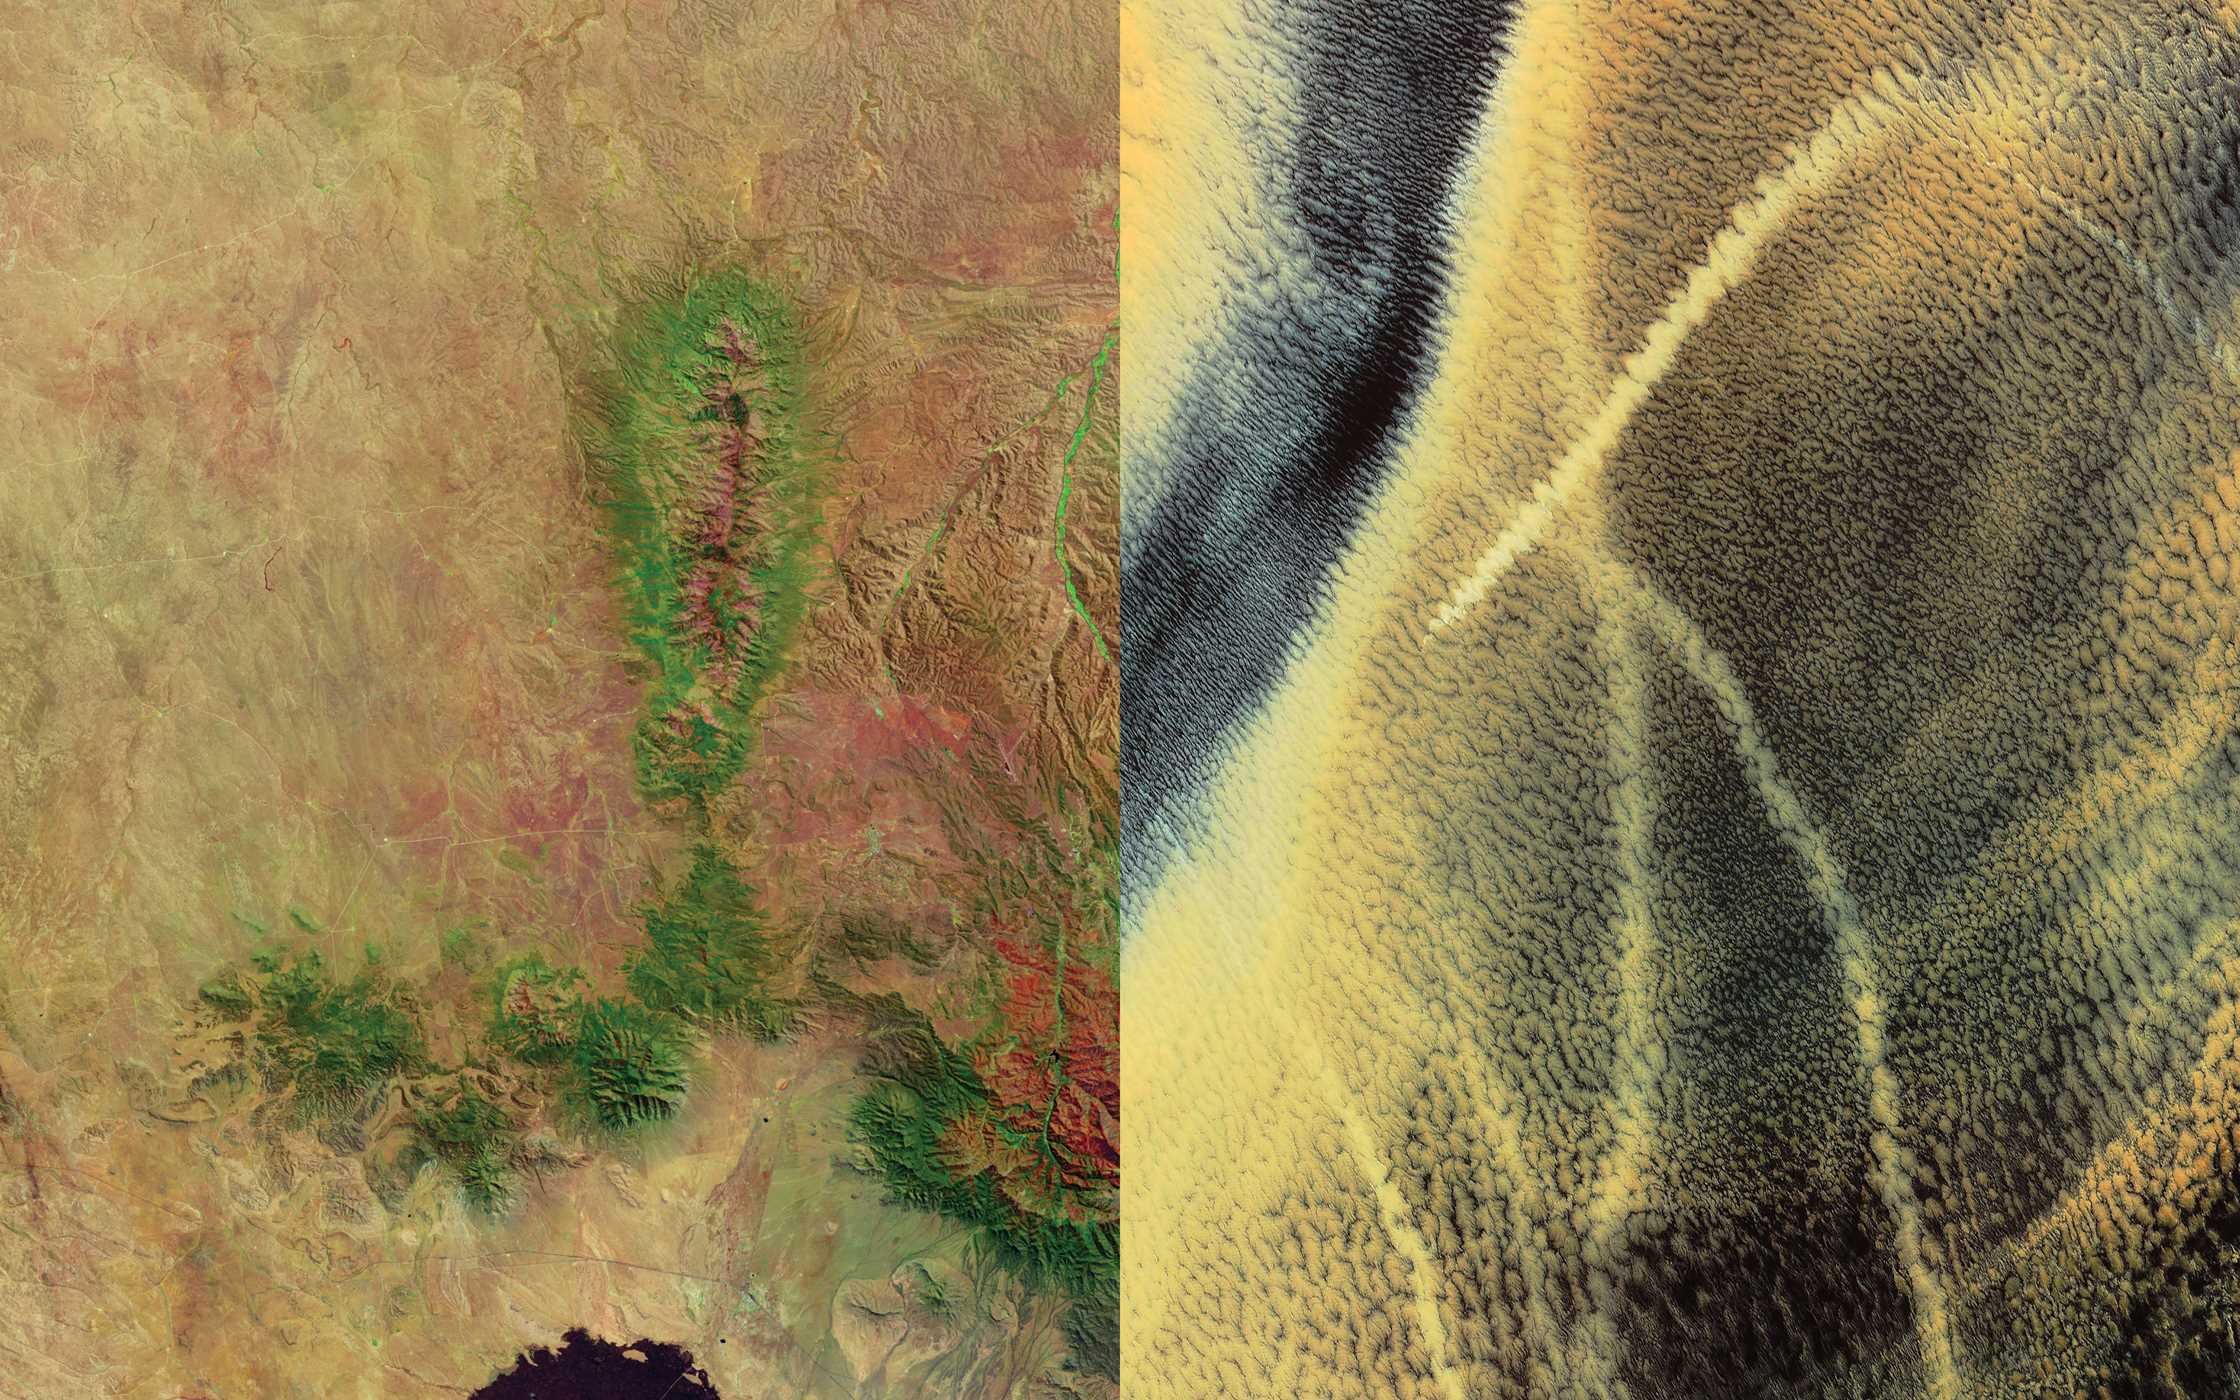
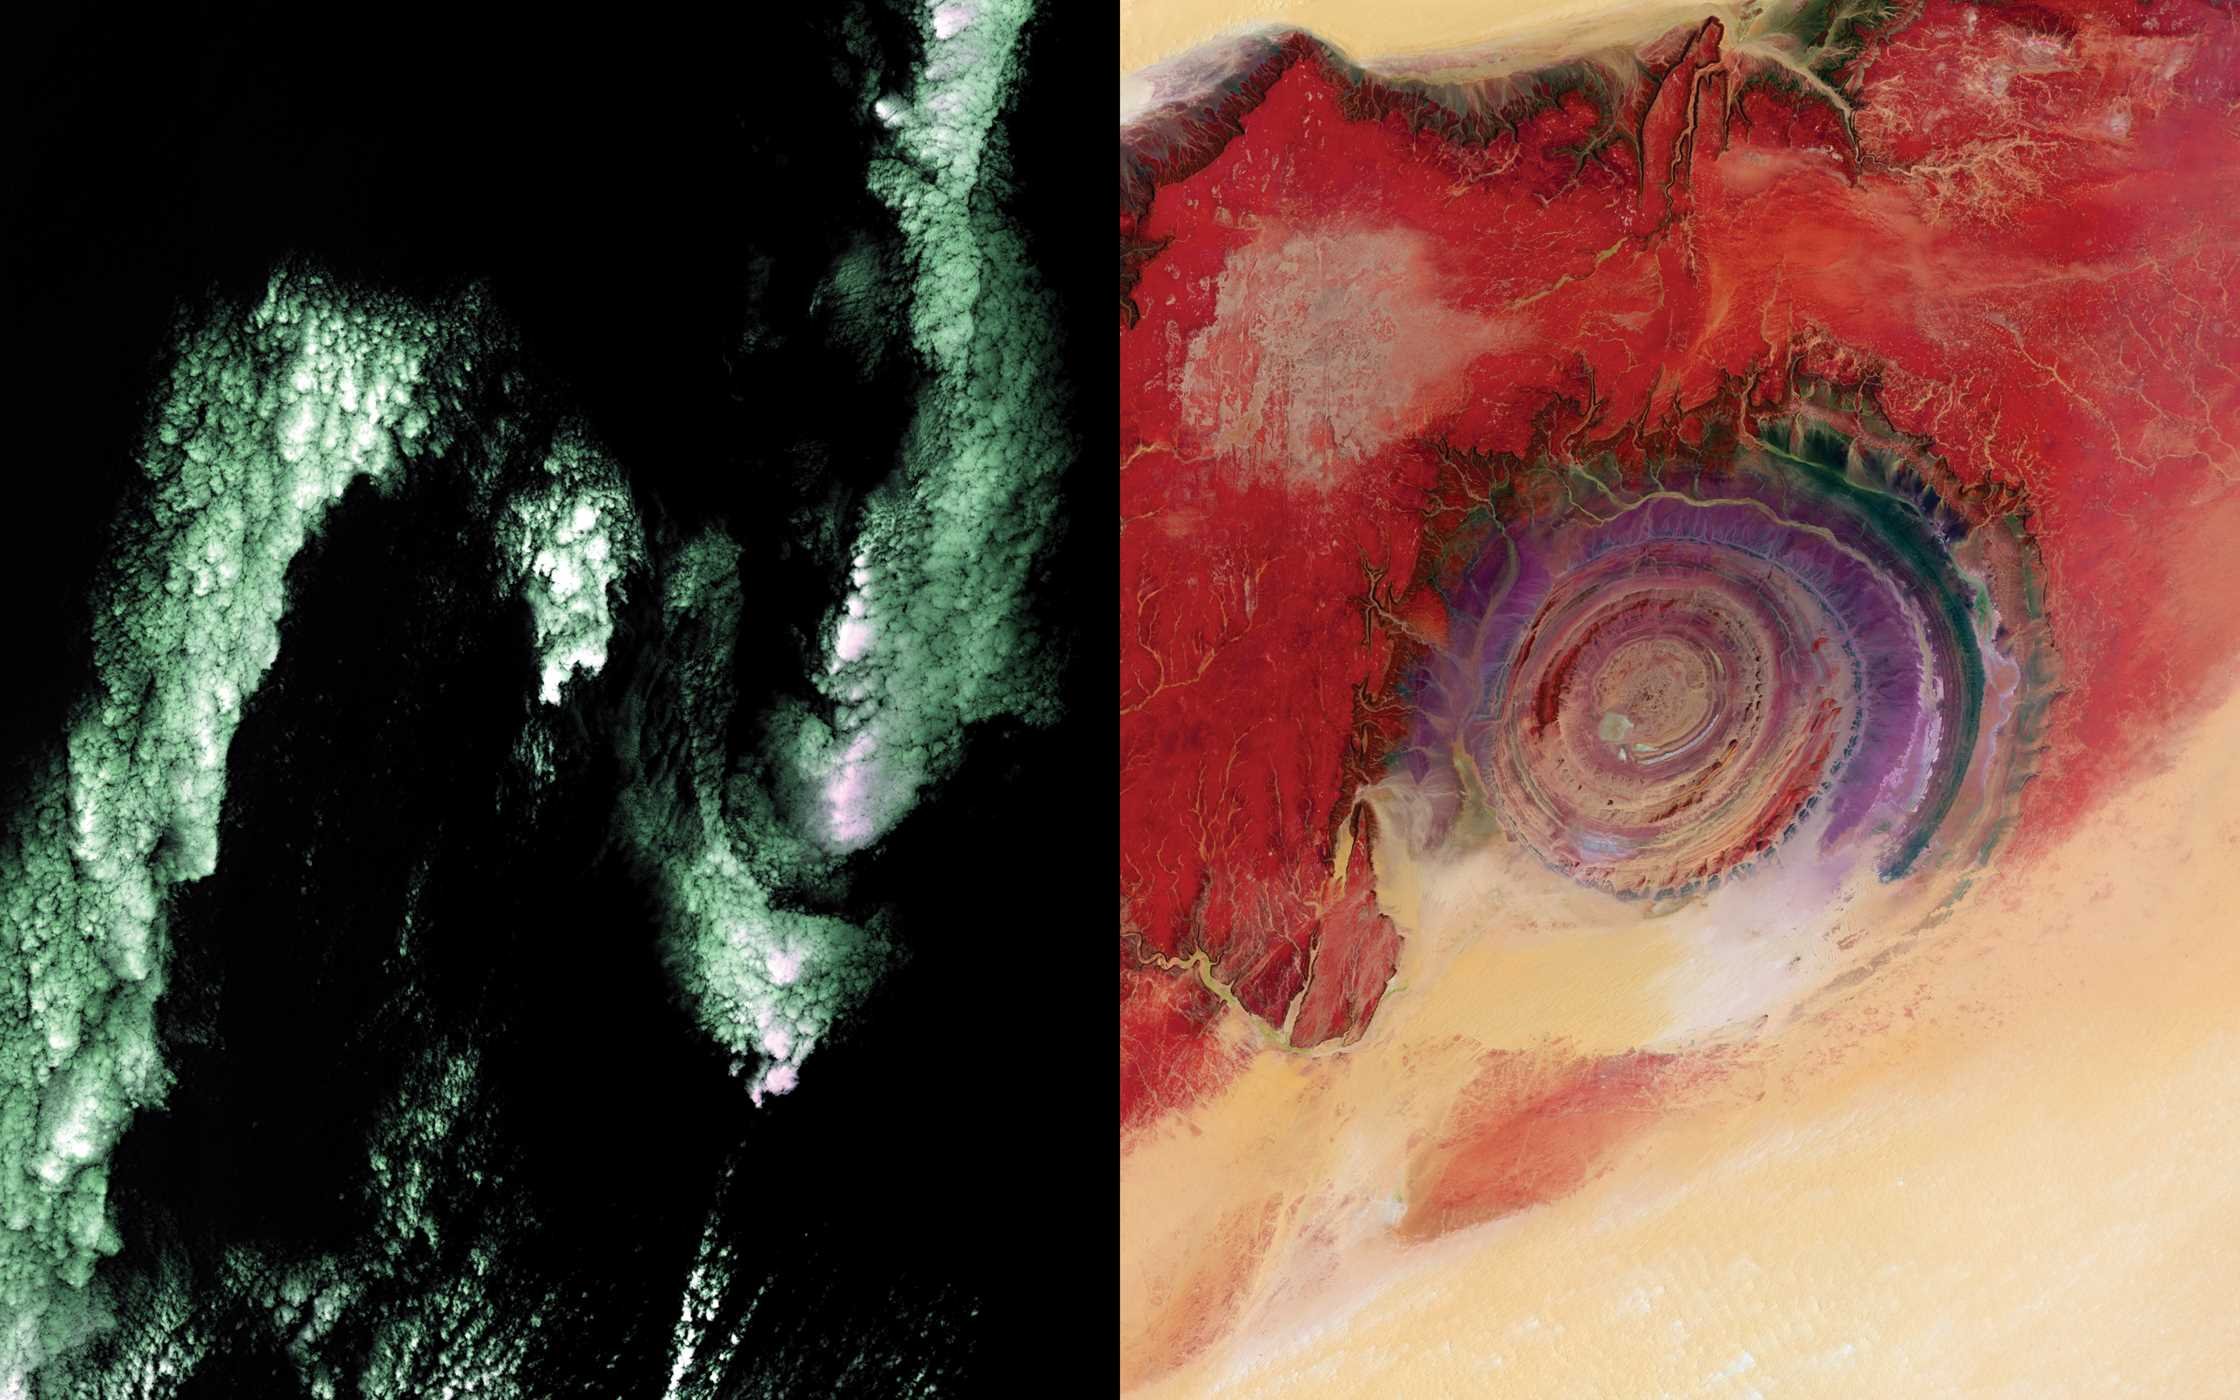
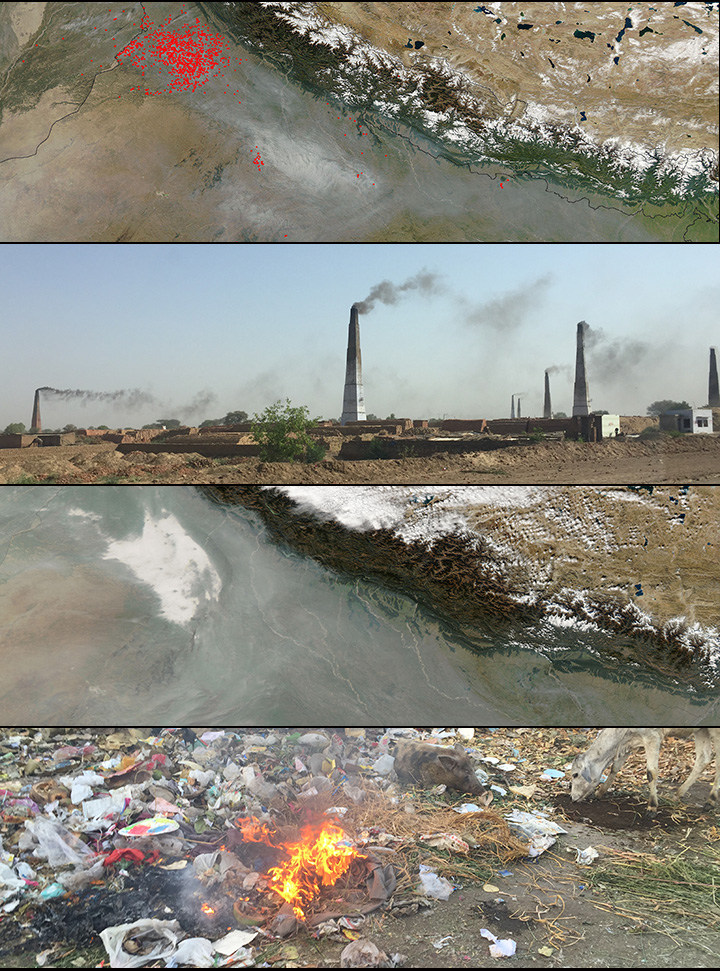
As a science writer for the NASA Earth Observatory, I spend many of my waking hours observing Earth from above. Over the last half century, the scientific community has lofted hundreds of satellites into orbit. Some are large, the size of buses; some are tiny, the size of a loaf of bread. Some are designed to study ice, others clouds, others the ocean, others forests, and others the particles of smoke and haze that drift in the atmosphere.
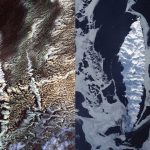
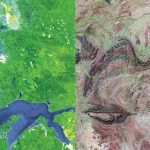
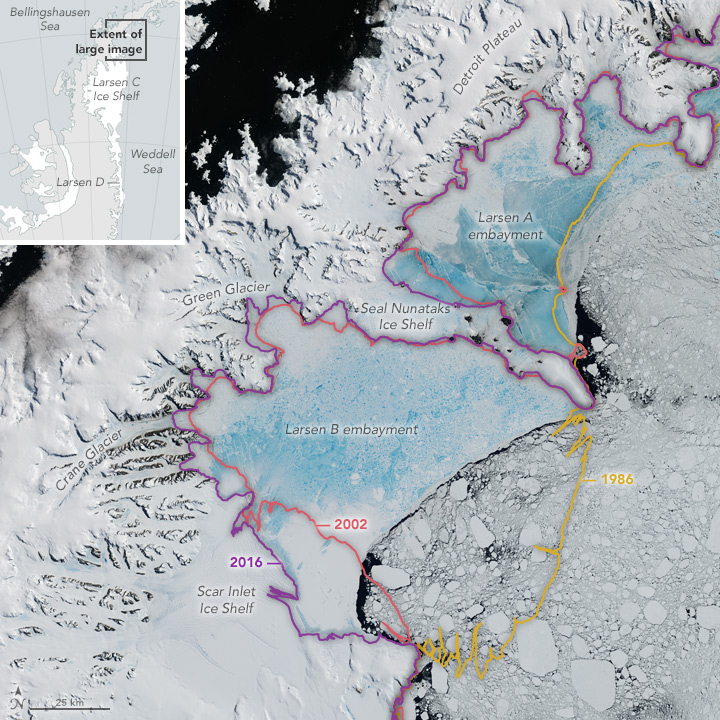
From space, we see vast transformations with these satellites. We see huge bands of fire where fires would never occur if people had not lit them. We see massive fields of once white glacial ice becoming brown and gray as winds paint them with soot and dust. We see oceans that were once clear swirling with explosive blooms of algae that thrive in polluted waters. We see once brimming lakes going dry.
I sometimes leave my office feeling pessimistic about the future. When you consider how drastically our planet has changed in the last few hundred years and how drastically it appears poised to continue changing, the problems can seem insurmountable. However, coming to northern India, meeting the Carbon 12 artists, and watching the care that went into the creation of each piece has reminded me that we have no choice but to confront these problems. There is simply too much at stake — too much history, too much beauty, too much about our planet that is irreplaceable for us to look the other way.
I am sure viewers of Carbon 12 will have other responses when they see these paintings — and they should — but I do hope that the overriding reaction is a complete inability to look away. Each painting is both a problem and a solution, a beginning and an end, an answer and a question. Every single one of them, like our home planet, is the product of cycles of creation and destruction. Every single one of them, like Jaipur, is a celebration of extremes.
 Note on images: Satellite images captured the MODIS sensor on NASA’s Aqua satellite. Learn more about them here. Photographs taken by Adam Voiland.